×
模态框(Modal)标题
在这里添加一些文本
Close
Close
Submit
Cancel
Confirm
×
模态框(Modal)标题
×
中国社会科学引文索引来源(CSSCI)期刊
中国人文社会科学核心期刊
中国中文核心期刊
中国最具国际影响力学术期刊
全国高校精品社科期刊
EN
中文
Home
About Journal
Editorial Board
Instruction
Browse
Current Issue
Online First
Highlights
Topic
Archive By Channels
Archive
Most Viewed
Most Download
Most Cited
E-mail Alert
RSS
Subscription
Contact us
EN
中文
Figure/Table detail
CHALLENGES AND RESPONSES: MEASUREMENT AND ANALYSIS OF THE GEOPOLITICAL INFLUENCE OF CHINA AND THE UNITED STATES ON COUNTRIES IN THE INDO-PACIFIC STRATEGY
Lin SUN, Zi YE, Yu-qi LU, Hai-yan SHAO, Shu-yun HU
HUMAN GEOGRAPHY
,
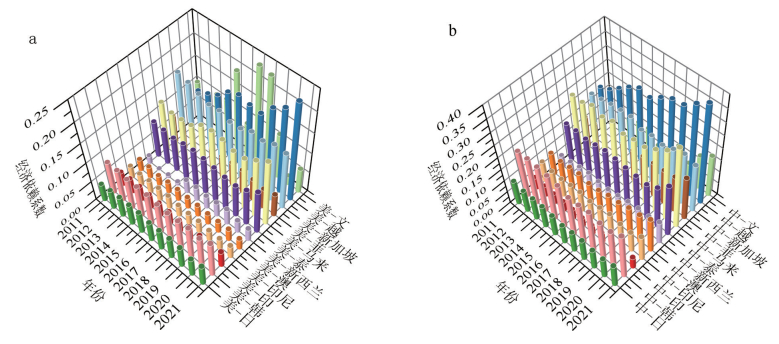
Fig. 9
Waterfall Chart of Changes in Economic Dependence Coefficient Between China and The United States and Countries in The Indo-Pacific Strategy Region (2011—2021)
Other figure/table from this article
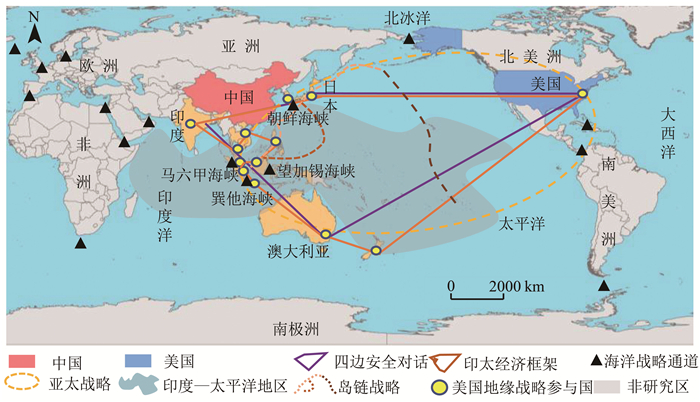
Fig. 1
Schematic Diagram of "The Indo-Pacific Strategy" Region and Related Geostrategies of The United States
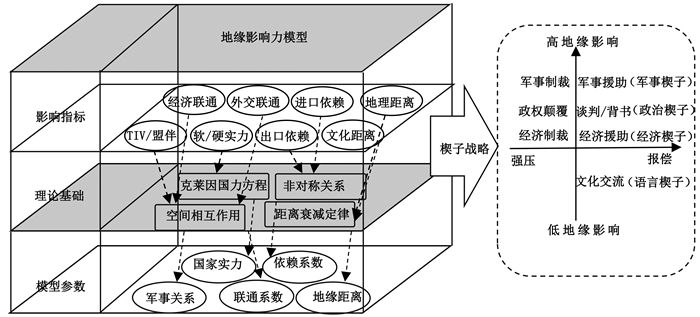
Fig. 2
An Analytical Framework for the Application of Wedge Strategy under the Evolution of Geopolitical Influence
Tab. 1
National Strength Evaluation Index System
Tab. 2
Shows the Classification of Geographical Relations Based on the Difference of Geographical Influence Between China and The United States
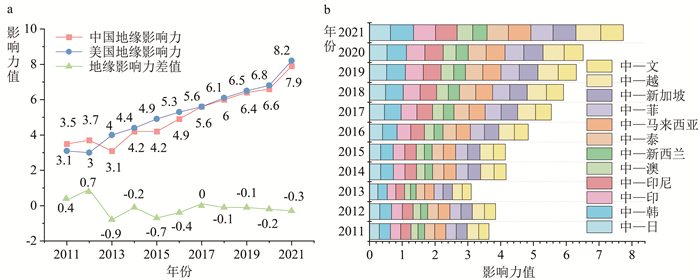
Fig. 3
Sum and Difference of China-US Geopolitical Influence in The Indo-Pacific Region and Accumulation Change Map in China (2011—2021)
Fig. 4
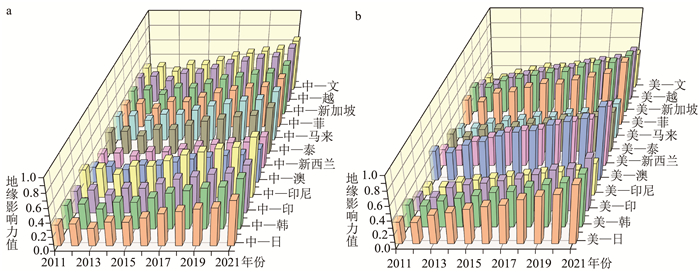
Comparison of the Geopolitical Influence of China and The United States on Typical Countries in The Indo-Pacific Strategy (2011—2021)
Fig. 5
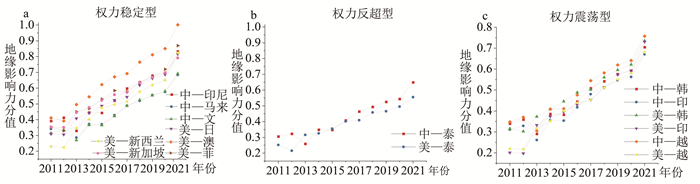
Evolution and Classification of Geopolitical Relations Between China and The United States and Typical Countries in The Indo-Pacific Strategic Region
Fig. 6
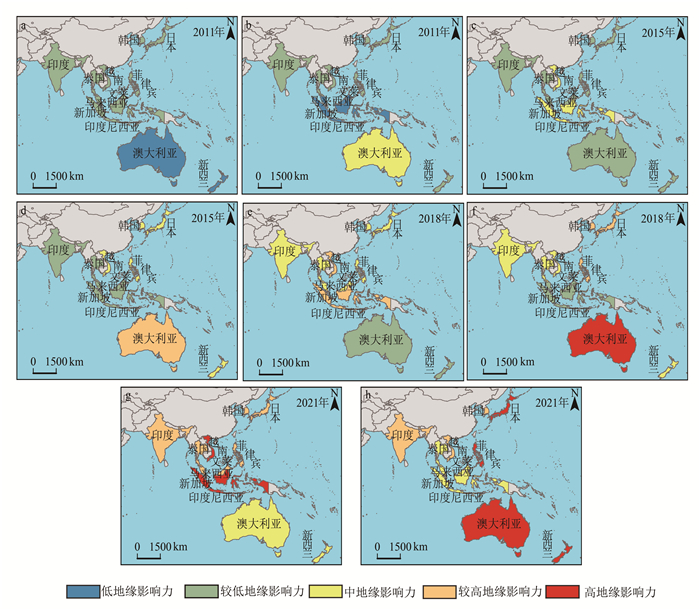
China (a, c, e, g) and The United States (b, d, f, h) Temporal and Spatial Evolution of Geopolitical Influence on Typical Countries in The Indo-Pacific Strategic Region
Fig. 7
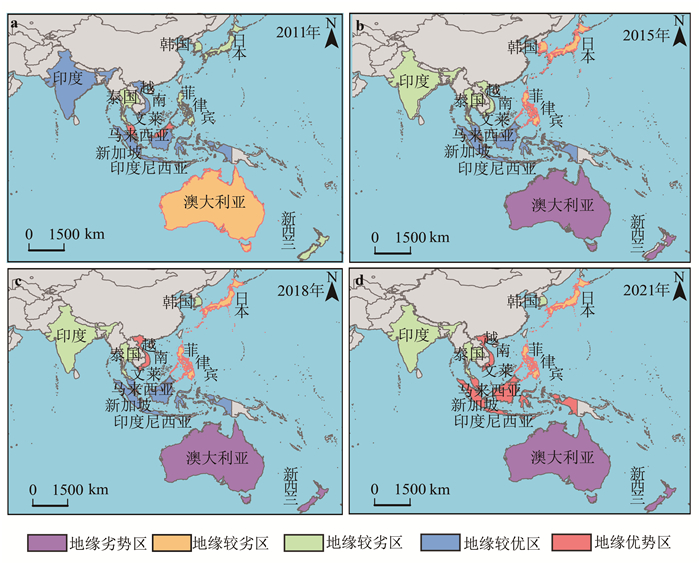
Evolution of the Geographical Relations Between China and Typical Countries in The Indo-Pacific Strategic Region
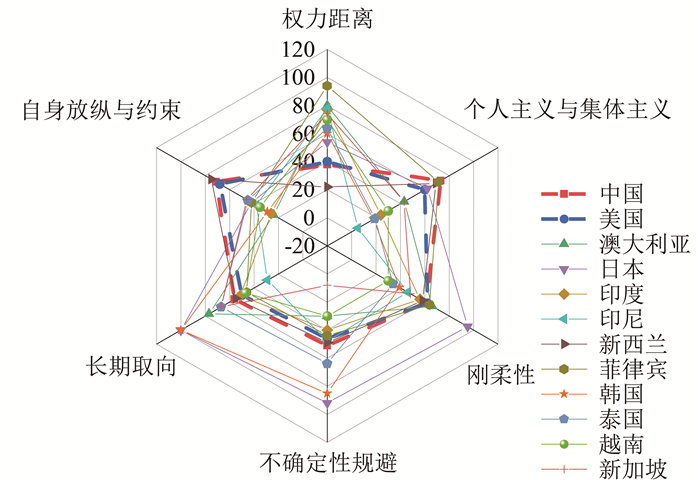
Fig. 8
Cultural Dimension Scores of Typical Countries in China, The United States and The Indo-Pacific Strategic Region